

The total domestic debt profile of subnational governments stood at N5.36 trillion by the end of the third quarter of 2022. Though the Debt Management Office (DMO) didn’t give a breakdown of the state government’s foreign debt, state government debt contributed 16.74 per cent of the total debt profile as of June 2022.
Subnational government debt stock was N7.17 trillion of the N42.85 trillion by the end of the second quarter of 2022.
The breakdown of subnational debt shows that N5.28 trillion form its domestic debt, and external debt accounted for N1.89 trillion.
While the federal government owes the bulk of the country’s total public debt, the state government also contributes to this.
Thus, Dataphyte analyses subnational government debt in four charts.
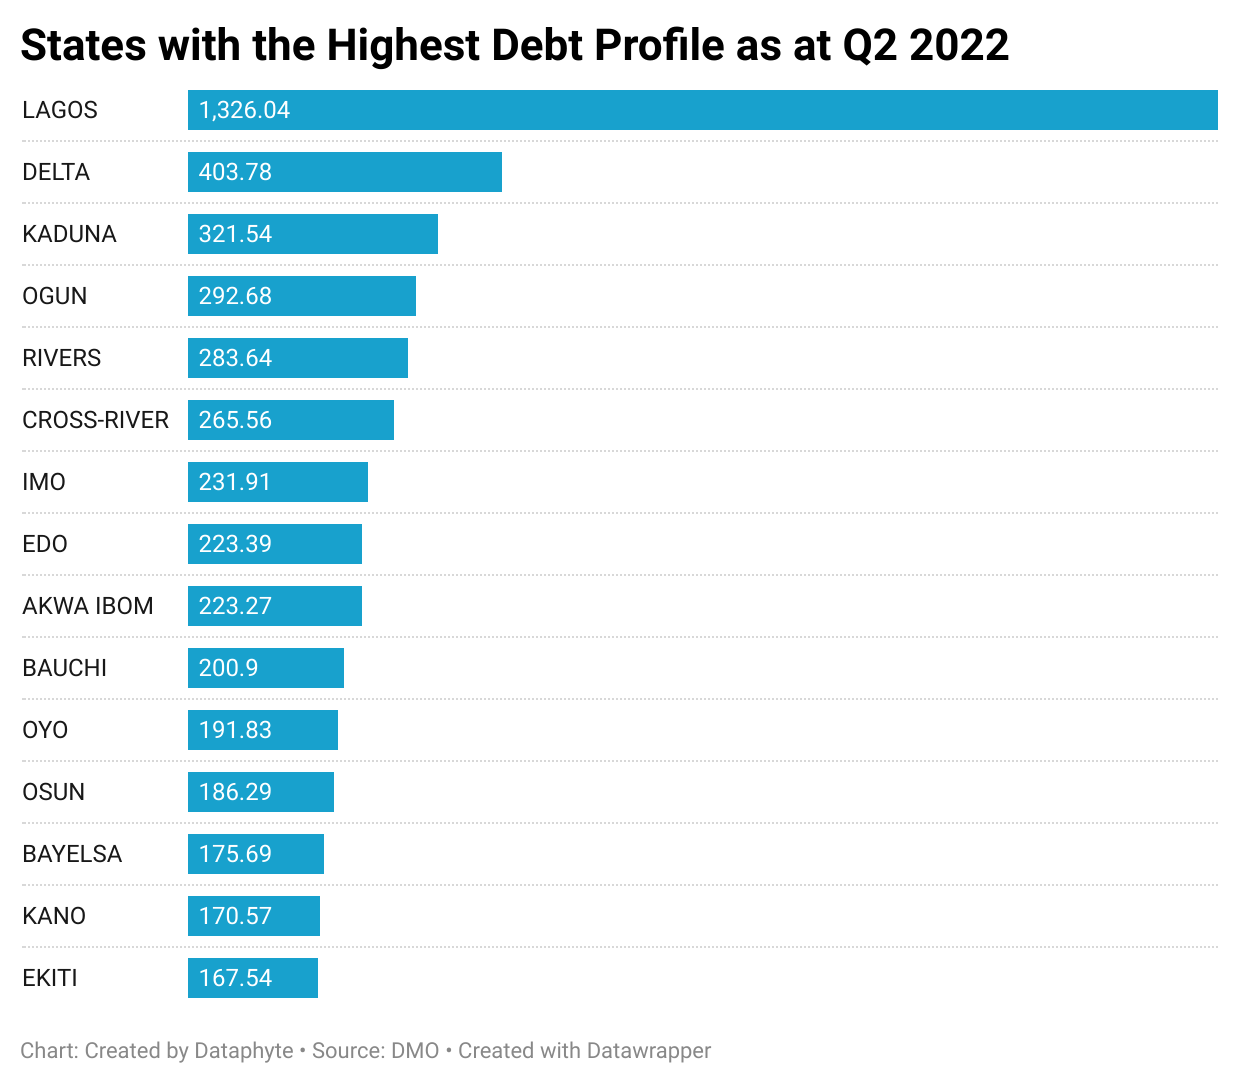
States with High Debt Profile
Lagos State had the highest debt profile amongst the 36 states and FCT. The state’s debt profile by the end of the second quarter of 2022 was N1.33 trillion naira. The state accounts for 18.49 per cent of the total N7.17 trillion subnational debt by June 2022.
Delta State accounted for 5.63 per cent of the total debt and had a debt profile of N403.78 billion. This placed the state in second place among states with high debt profiles.
Kaduna State with a debt profile of N321.54 billion came in third place. This figure represents 4.48 per cent of the total debt of the sub-national government.
Ogun and Rivers placed fourth and fifth with a debt profile of N292.68 billion and N283.64 billion, respectively. Their debt profile accounted for 4.08 per cent and 3.95 per cent, respectively.

In descending order, the five states with low debt profiles are Katsina, FCT, Ebonyi, Kebbi, and Jigawa states.
Jigawa State had the lowest debt profile, with total debt of N56.59 billion. This amount is less than one per cent (0.79) of the total debt of the subnational government.
Kebbi State is second from behind as the state’s debt profile stood at N78 billion. This figure is 1.09 per cent of the total debt of the state governments.
The debt profile of the others is N83.93 billion in Ebonyi State, N86.31 billion in the FCT, and NN89.83 billion in Katsina State.
How State’s Debt Increase Between 2015 and June 2022
The subnational debt profile increased from N3.17 trillion by the end of 2015 to N7.17 in June 2022. This shows that there was a N4.01 trillion increase in the total debt profile of state governments between the end of 2015 and June 2022.
However, this increase varies from state to state. Lagos State again recorded the highest increase over the period. The state’s debt profile increased from N455.89 billion in 2015 to N1.33 trillion in June 2022. This gives a difference of N870.15 billion.
Kaduna State, with the third highest debt profile amongst subnational governments, had the second-highest increase over the period. The state’s debt increased by N227.21 billion, from N94.33 billion in 2015 to N321.54 billion in June 2022.
Ogun State had the third highest increase as the state’s debt profile increased from N96.23 billion in 2015 to N292.68 billion in June 2022. This shows that the state’s debt profile increased by N196.46 billion.
With an increase of N148.54 billion, Imo State recorded the fourth-highest increase. The state’s debt profile rose from N83.37 billion in 2015 to N231.91 billion in June 2022.
The debt profile of Edo State increased from N79.34 billion in 2015 to N223.39 billion in June 2022. This signifies an increase of N144.06 billion to place fifth.

The debt profile of the Federal Capital Territory (FCT) decreased over the period. The capital city’s debt profile dropped from N140.79 billion in 2015 to N86.31 billion in June 2022. This shows that the city’s debt dropped by N54.48 billion.
Kebbi State recorded the second-lowest debt change over the period. The state’s debt increased from N72.69 billion to N78 billion, an N5.31 billion increase.
Osun State’s debt profile increased by N25.48 billion to be the third-lowest state. The state’s debt as at the end of 2015 was N159.81 billion, and it increased to N186.29 in June 2022.
Jigawa and Ebonyi states recorded the fourth and fifth lowest increases, respectively. In Jigawa State, the debt profile increased from N28.89 billion to N56.59 billion. This represents an N27.69 billion increase. That of Ebonyi State increased by N40.49 billion, from N43.44 billion to N83.93 billion.
While Lagos State had the highest debt profile and a nominal increase in debt between 2015 and June 2022, the state’s percentage change over the period is not the highest. The state ranked 14th on this rating with a 190.87 per cent increase.
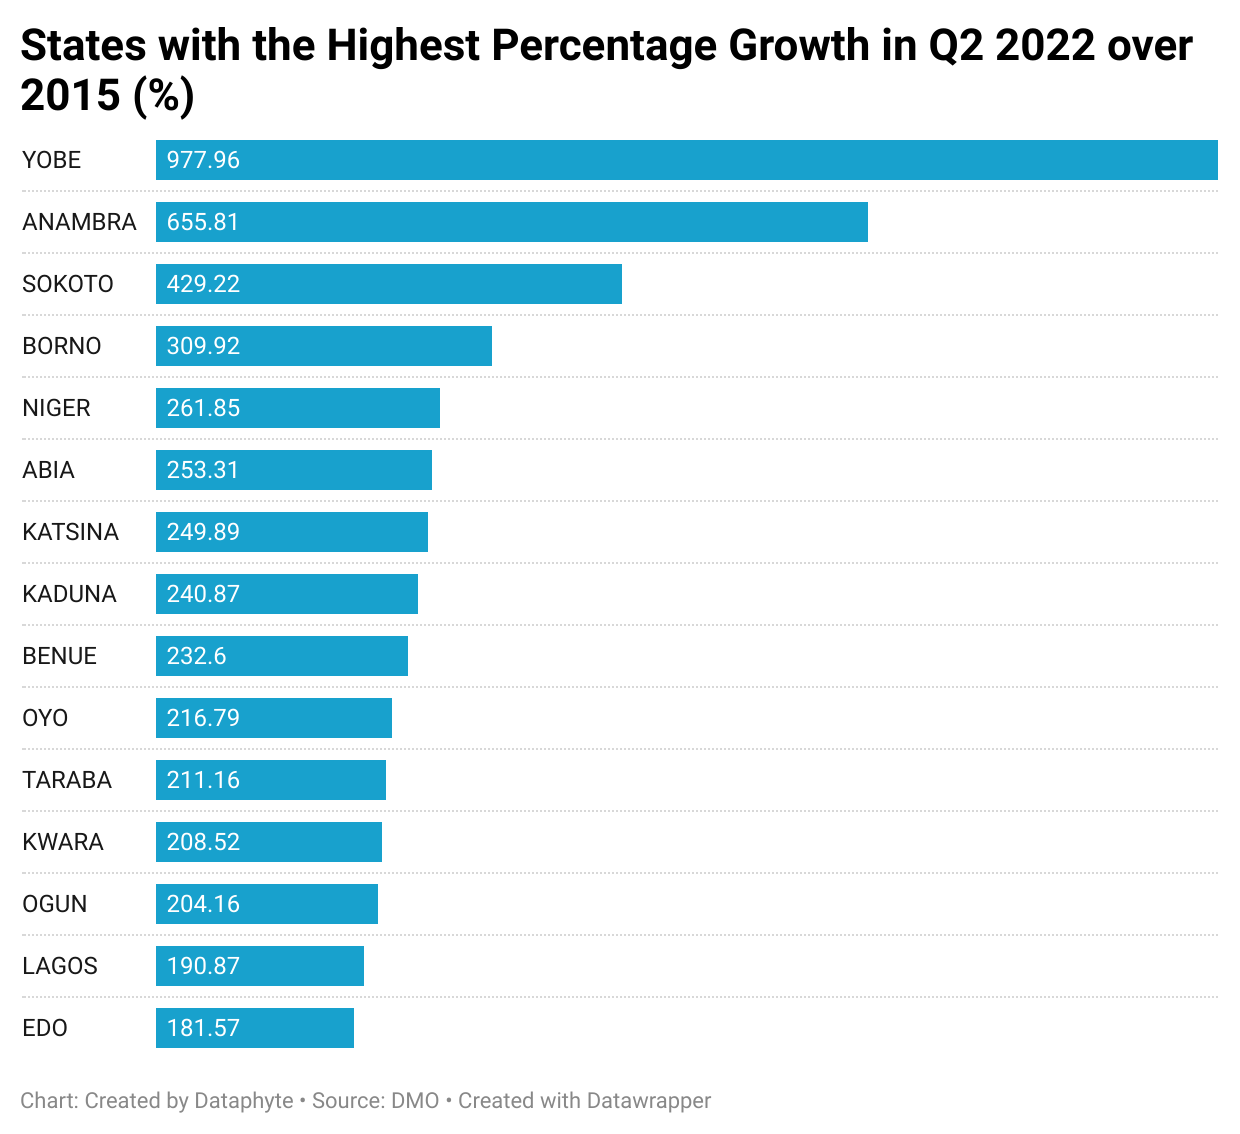
States with High Percentage Increase in Debt
Yobe State’s debt profile increased by 977.96 per cent to be the state with the highest percentage change in debt profile. The state’s debt profile increased by 96.35 billion, from N9.85 billion in 2015 to N106.2 billion in June 2022.
With a 655.81 per cent increase in, Anambra State recorded the second-highest percentage increase. The state’s debt profile increased from N15.52 billion in 2015 to 117.3 billion in June 2022.
Sokoto State’s debt increased from N19.9 billion in 2015 to N105.32 billion in June 2022 to place third in percentage increase. The debt profile thus increased by 429.22 per cent.
That of Borno and Niger states increased by 309.92 per cent and 261.85 per cent, respectively, in fourth and fifth place.
The five states with the least percentage increase are the FCT with the least, Kebbi, Osun, Delta, and Akwa Ibom.
FCT had a 38.7 per cent decrease, while the other states’ respective increases are 7.31 per cent, 16.57 per cent, 23.02 per cent, and 41.37 per cent.
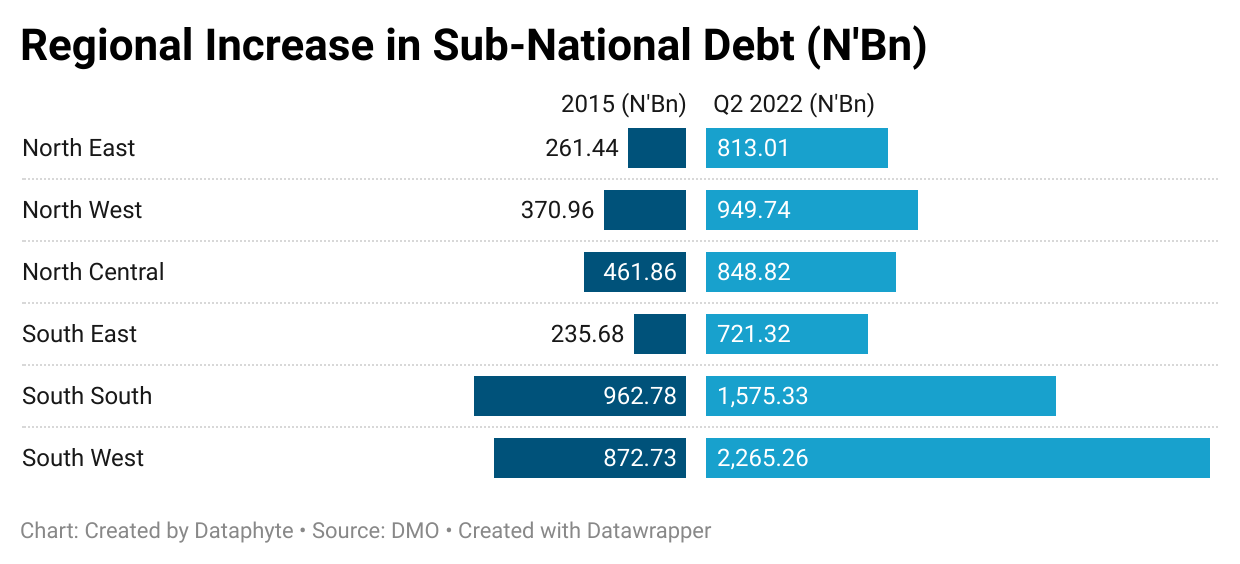
Regional Analysis of Debt Profile
Regional debt analysis shows that, while the southwest region had the highest debt profile and a nominal increase in debt profile between 2015 and June 2022, the northeast region had the highest percentage increase in debt profile.
The southwest region had a debt profile of N2.27 trillion by the end of June 2022. This was the highest debt profile by region. This was followed by the south-south region with a debt profile of N1.56 trillion.
The debt profile of other regions is N949.74 billion in the northwest to place third, and N848.82 billion in the north-central region in fourth place. The northeast region occupied the fifth and sixth place with a debt profile of N813.01 billion debt profile and the southeast region with a debt profile of N721.32 billion.

The southwest region also has the highest nominal increase of N1.39 trillion. The south-south follows this with an increase of N612.55 billion, and the northwest region with N578.78 billion.
The increase in the northeast was N551.56 billion in the fourth place, N485.65 billion in the southeast in the fifth place, and N386.96 billion in the north-central region in the sixth place.
However, the northeast region’s debt profile increased by 210.97 per cent to be the region with the highest percentage increase.
In the southeast region, it increased by 206.07 per cent in second place, and 159.56 per cent in the southwest region in the third place.
The debt profile of the northwest region increased by 156.02 per cent, the north-central region by 83.78 per cent, and the southeast region by 63.62 per cent to occupy the last three positions.